
Key facts
- FEMA records 4,092 NFIP flood insurance claims in the 98 Los Angeles ZIP codes on this page, with $25,582,624 paid on buildings and contents (calculated by Los Angeles Water Damage & Mold on November 14, 2026). FEMA OpenFEMA NFIP Redacted Claims v3
- The Los Angeles ZIP codes with the most NFIP flood claims are 90049 (391 claims), 90046 (300 claims), 90272 (256 claims) (calculated by Los Angeles Water Damage & Mold on November 14, 2026). FEMA OpenFEMA NFIP Redacted Claims v3
- The City of Los Angeles is Class 7 in FEMA's Community Rating System, which lowers flood insurance premiums 15 percent for policies on properties in mapped flood zones. LA Bureau of Engineering: Community Rating System
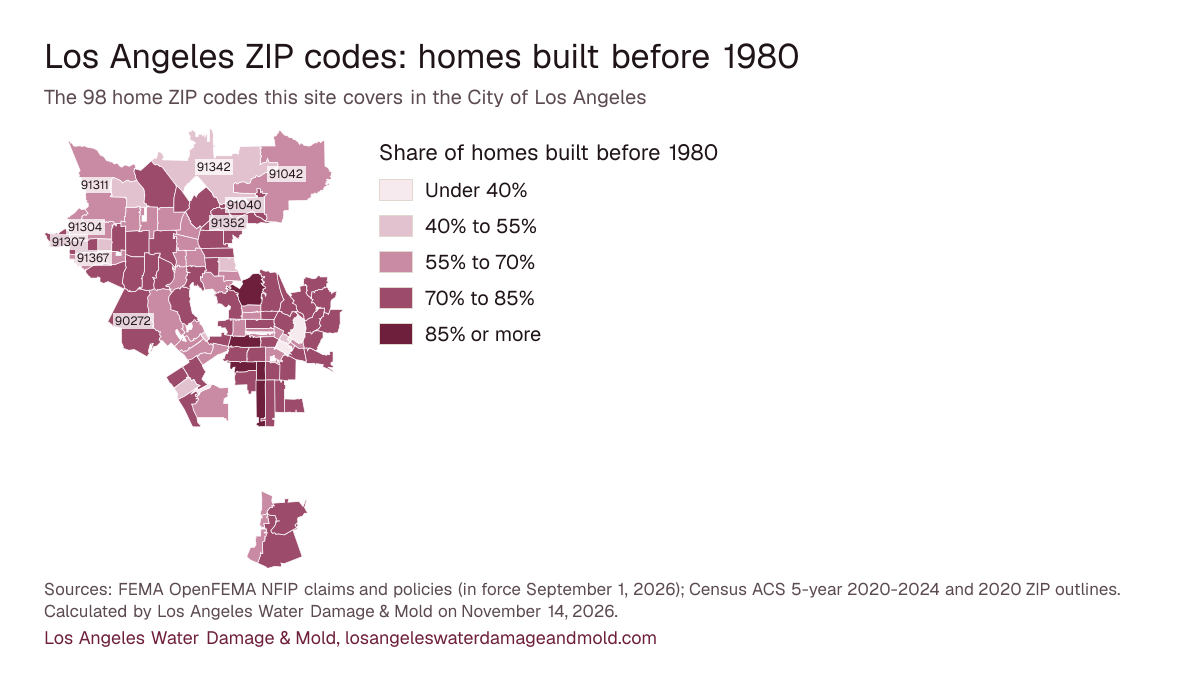
- About 70% of homes in these Los Angeles ZIP codes were built before 1980, by Census estimates for ACS 5-year 2020-2024 (calculated by Los Angeles Water Damage & Mold on November 14, 2026). U.S. Census Bureau ACS, tables B25034 and B25035
What these numbers can and can't tell you
These are NFIP flood insurance claims only. Losses paid by private flood insurers or homeowners policies, and losses nobody insured, are missing, so a ZIP with few claims may just have few policyholders. ZIP codes are as reported to FEMA. A ZIP with fewer than 5 claims shows "fewer than 5" and no dollar total. The home-age figures are Census survey estimates for ZIP Code Tabulation Areas: close to postal ZIPs, not identical, and each with a margin of error. The city share measures land, not homes (Census 2020 relationship file), so a ZIP that crosses the city line also counts claims and homes from the neighboring city or county land.
ZIP 90049 has both the most claims (391) and the largest total paid ($3,979,352). 2,052 of the 4,092 claims across all 98 ZIPs had a payment.
The ZIP map
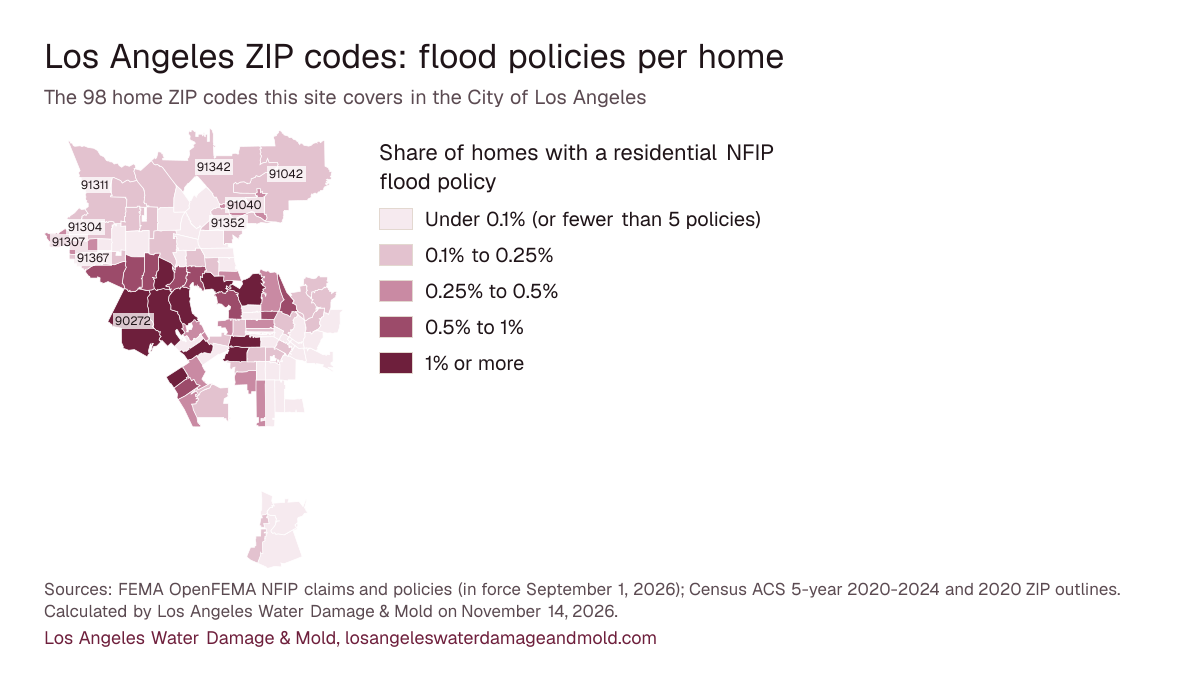
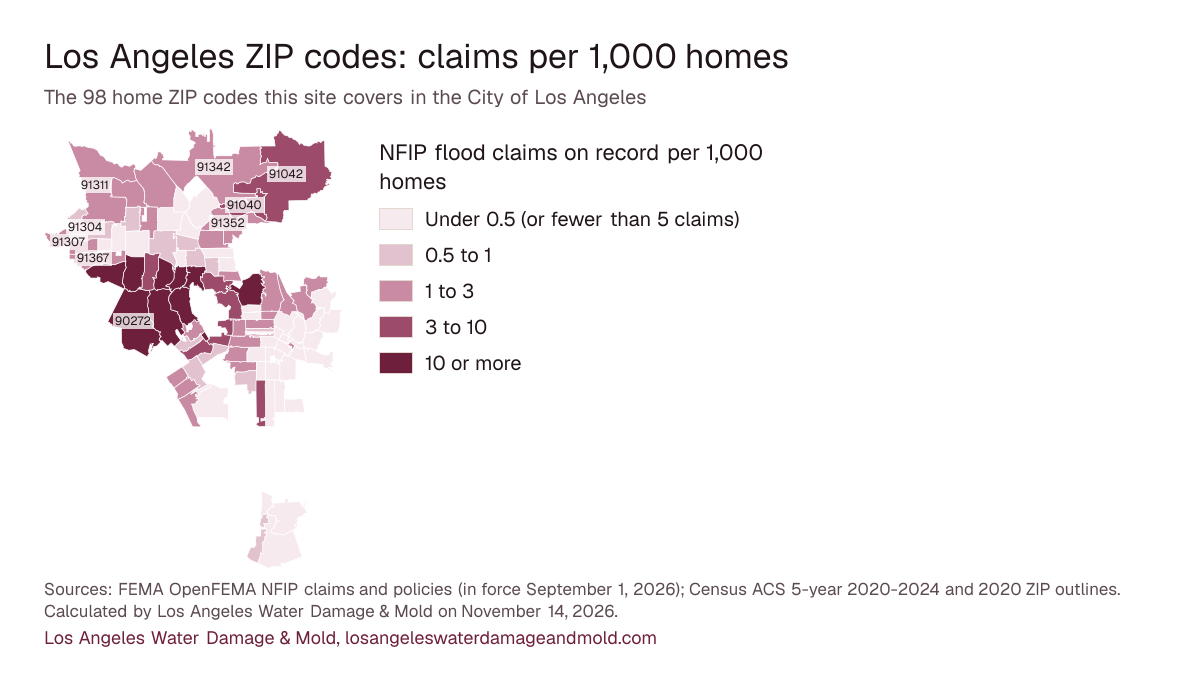
Among ZIPs with at least 5 residential flood policies, coverage runs from 0.02% of homes in 91331 to 4.43% in 90077. Use the buttons to change what the shading shows; every value is also in the table below.
Share of homes with a residential NFIP flood policy
- Under 0.1% (or fewer than 5 policies)
- 0.1% to 0.25%
- 0.25% to 0.5%
- 0.5% to 1%
- 1% or more
NFIP flood claims on record per 1,000 homes
- Under 0.5 (or fewer than 5 claims)
- 0.5 to 1
- 1 to 3
- 3 to 10
- 10 or more
Share of homes built before 1980
- Under 40%
- 40% to 55%
- 55% to 70%
- 70% to 85%
- 85% or more
Sources: FEMA OpenFEMA NFIP claims and policies (in force September 1, 2026); Census ACS 5-year 2020-2024 and 2020 ZIP outlines. Calculated by Los Angeles Water Damage & Mold on November 14, 2026. Map pictures to download: flood policies per home, claims per 1,000 homes, homes built before 1980.
| Area | With a payment | Policies in force | ||||||
|---|---|---|---|---|---|---|---|---|
| 90049 | Westside and the coast (99% of its land in the city) | 391 | 220 | $3,979,352 | 336 | 1.79% | 1968 | 69% |
| 90046 | Hollywood, Silver Lake, Echo Park and Mid-City (87% of its land in the city) | 300 | 143 | $1,469,297 | 200 | 0.62% | 1966 | 72% |
| 90272 | Westside and the coast (100% of its land in the city) | 256 | 81 | $2,026,861 | 145 | 1.56% | 1967 | 70% |
| 90077 | Westside and the coast (100% of its land in the city) | 246 | 121 | $2,807,717 | 166 | 4.43% | 1970 | 78% |
| 91403 | South San Fernando Valley (100% of its land in the city) | 211 | 133 | $1,505,286 | 77 | 0.59% | 1971 | 67% |
| 91436 | South San Fernando Valley (100% of its land in the city) | 201 | 117 | $1,287,312 | 106 | 1.69% | 1962 | 75% |
| 91364 | South San Fernando Valley (96% of its land in the city) | 181 | 105 | $977,572 | 73 | 0.67% | 1967 | 71% |
| 90068 | Hollywood, Silver Lake, Echo Park and Mid-City (100% of its land in the city) | 180 | 90 | $1,357,336 | 148 | 1.01% | 1958 | 86% |
| 91423 | South San Fernando Valley (100% of its land in the city) | 172 | 91 | $674,750 | 113 | 0.67% | 1966 | 75% |
| 91604 | South San Fernando Valley (100% of its land in the city) | 160 | 83 | $912,561 | 172 | 1.07% | 1972 | 63% |
| 91356 | South San Fernando Valley (100% of its land in the city) | 133 | 74 | $755,339 | 85 | 0.67% | 1973 | 78% |
| 91316 | South San Fernando Valley (100% of its land in the city) | 131 | 72 | $754,010 | 78 | 0.57% | 1969 | 75% |
| 90048 | Hollywood, Silver Lake, Echo Park and Mid-City (85% of its land in the city) | 108 | 39 | $485,243 | 38 | 0.27% | 1961 | 74% |
| 90035 | Westside and the coast (100% of its land in the city) | 79 | 41 | $393,521 | 28 | 0.19% | 1961 | 75% |
| 90019 | Hollywood, Silver Lake, Echo Park and Mid-City (100% of its land in the city) | 74 | 24 | $87,823 | 387 | 1.47% | 1945 | 85% |
| 90047 | South LA (67% of its land in the city) | 63 | 15 | $32,004 | 74 | 0.41% | 1946 | 87% |
| 91367 | South San Fernando Valley (100% of its land in the city) | 61 | 35 | $531,719 | 42 | 0.20% | 1975 | 59% |
| 91042 | North San Fernando Valley and the foothills (20% of its land in the city) | 59 | 33 | $272,502 | 23 | 0.21% | 1964 | 68% |
| 91040 | North San Fernando Valley and the foothills (100% of its land in the city) | 56 | 37 | $276,154 | 41 | 0.49% | 1959 | 80% |
| 90016 | South LA (99% of its land in the city) | 54 | 10 | $61,610 | 258 | 1.29% | 1949 | 81% |
| 90064 | Westside and the coast (100% of its land in the city) | 49 | 20 | $122,906 | 259 | 2.00% | 1964 | 67% |
| 90024 | Westside and the coast (97% of its land in the city) | 47 | 22 | $144,444 | 53 | 0.26% | 1975 | 61% |
| 90008 | South LA (91% of its land in the city) | 39 | 10 | $21,076 | 40 | 0.25% | 1955 | 87% |
| 90036 | Hollywood, Silver Lake, Echo Park and Mid-City (100% of its land in the city) | 38 | 22 | $241,168 | 24 | 0.11% | 1950 | 69% |
| 91342 | North San Fernando Valley and the foothills (38% of its land in the city) | 36 | 20 | $119,275 | 48 | 0.18% | 1977 | 53% |
| 90004 | Hollywood, Silver Lake, Echo Park and Mid-City (100% of its land in the city) | 34 | 18 | $668,093 | 122 | 0.46% | 1961 | 74% |
| 91352 | North San Fernando Valley and the foothills (100% of its land in the city) | 32 | 20 | $134,000 | 28 | 0.21% | 1961 | 77% |
| 90067 | Westside and the coast (100% of its land in the city) | 32 | 11 | $61,332 | 11 | 0.42% | 1980 | 50% |
| 90027 | Hollywood, Silver Lake, Echo Park and Mid-City (100% of its land in the city) | 32 | 14 | $124,211 | 77 | 0.31% | 1957 | 81% |
| 91344 | North San Fernando Valley and the foothills (100% of its land in the city) | 31 | 18 | $126,777 | 28 | 0.15% | 1963 | 84% |
| 90291 | Westside and the coast (100% of its land in the city) | 31 | 14 | $182,224 | 741 | 4.35% | 1959 | 74% |
| 91307 | South San Fernando Valley (52% of its land in the city) | 27 | 11 | $308,874 | 32 | 0.35% | 1966 | 75% |
| 90065 | Boyle Heights and Northeast LA (100% of its land in the city) | 27 | 13 | $174,233 | 43 | 0.25% | 1952 | 78% |
| 91311 | North San Fernando Valley and the foothills (35% of its land in the city) | 25 | 13 | $117,785 | 37 | 0.25% | 1974 | 68% |
| 90034 | Westside and the coast (100% of its land in the city) | 24 | 10 | $83,641 | 26 | 0.09% | 1971 | 67% |
| 90039 | Hollywood, Silver Lake, Echo Park and Mid-City (99% of its land in the city) | 23 | 15 | $233,239 | 121 | 0.90% | 1952 | 79% |
| 90292 | Westside and the coast (57% of its land in the city) | 22 | 16 | $99,929 | 173 | 1.00% | 1985 | 45% |
| 90014 | Downtown, Koreatown, Westlake and Pico-Union (100% of its land in the city) | 21 | 18 | $54,498 | fewer than 5 | Not shown | 1938 | 70% |
| 91326 | North San Fernando Valley and the foothills (100% of its land in the city) | 20 | 8 | $79,264 | 24 | 0.17% | 1982 | 48% |
| 90029 | Hollywood, Silver Lake, Echo Park and Mid-City (100% of its land in the city) | 20 | 6 | $42,434 | 115 | 0.79% | 1960 | 79% |
| 91605 | South San Fernando Valley (100% of its land in the city) | 19 | 15 | $171,211 | 12 | 0.07% | 1964 | 79% |
| 90025 | Westside and the coast (93% of its land in the city) | 17 | 5 | $22,056 | 25 | 0.10% | 1975 | 62% |
| 91325 | North San Fernando Valley and the foothills (100% of its land in the city) | 15 | 9 | $33,690 | 21 | 0.15% | 1970 | 67% |
| 90066 | Westside and the coast (90% of its land in the city) | 15 | 9 | $81,336 | 79 | 0.29% | 1967 | 72% |
| 90041 | Boyle Heights and Northeast LA (100% of its land in the city) | 15 | 11 | $92,859 | 20 | 0.19% | 1947 | 82% |
| 91304 | South San Fernando Valley (68% of its land in the city) | 14 | 11 | $240,021 | 31 | 0.16% | 1972 | 68% |
| 90043 | South LA (69% of its land in the city) | 14 | fewer than 5 | $3,981 | 46 | 0.25% | 1947 | 84% |
| 91401 | South San Fernando Valley (100% of its land in the city) | 13 | 5 | $44,414 | 16 | 0.10% | 1968 | 67% |
| 90293 | Westside and the coast (100% of its land in the city) | 13 | 7 | $35,911 | 28 | 0.39% | 1973 | 73% |
| 91602 | South San Fernando Valley (100% of its land in the city) | 12 | 11 | $158,722 | 30 | 0.28% | 1973 | 58% |
| 91406 | South San Fernando Valley (100% of its land in the city) | 12 | 7 | $12,543 | 29 | 0.15% | 1965 | 71% |
| 91405 | South San Fernando Valley (100% of its land in the city) | 12 | 7 | $89,017 | 11 | 0.05% | 1973 | 65% |
| 90005 | Downtown, Koreatown, Westlake and Pico-Union (100% of its land in the city) | 12 | fewer than 5 | $26,838 | 14 | 0.07% | 1963 | 64% |
| 90042 | Boyle Heights and Northeast LA (100% of its land in the city) | 11 | fewer than 5 | $3,800 | 27 | 0.12% | 1952 | 77% |
| 91607 | South San Fernando Valley (100% of its land in the city) | 10 | fewer than 5 | $17,260 | 20 | 0.13% | 1969 | 72% |
| 91324 | North San Fernando Valley and the foothills (100% of its land in the city) | 10 | fewer than 5 | $12,527 | 18 | 0.15% | 1970 | 68% |
| 90020 | Downtown, Koreatown, Westlake and Pico-Union (100% of its land in the city) | 10 | 6 | $50,506 | 45 | 0.23% | 1973 | 65% |
| 91343 | North San Fernando Valley and the foothills (100% of its land in the city) | 9 | 6 | $26,866 | 14 | 0.07% | 1968 | 67% |
| 91335 | South San Fernando Valley (100% of its land in the city) | 9 | 6 | $6,483 | 17 | 0.07% | 1963 | 73% |
| 90731 | Harbor (98% of its land in the city) | 9 | 6 | $143,045 | 19 | 0.08% | 1965 | 75% |
| 90045 | Westside and the coast (99% of its land in the city) | 9 | fewer than 5 | $7,358 | 23 | 0.13% | 1960 | 63% |
| 90044 | South LA (69% of its land in the city) | 9 | fewer than 5 | $46,963 | 9 | 0.03% | 1957 | 74% |
| 91402 | North San Fernando Valley and the foothills (100% of its land in the city) | 8 | fewer than 5 | $87,858 | fewer than 5 | Not shown | 1967 | 70% |
| 90026 | Hollywood, Silver Lake, Echo Park and Mid-City (100% of its land in the city) | 8 | fewer than 5 | $24,636 | 37 | 0.13% | 1945 | 76% |
| 90028 | Hollywood, Silver Lake, Echo Park and Mid-City (100% of its land in the city) | 7 | fewer than 5 | $61,897 | fewer than 5 | Not shown | 1967 | 60% |
| 90018 | South LA (100% of its land in the city) | 7 | fewer than 5 | $65,211 | 24 | 0.13% | 1943 | 83% |
| 90017 | Downtown, Koreatown, Westlake and Pico-Union (100% of its land in the city) | 7 | fewer than 5 | $12,146 | fewer than 5 | Not shown | 1991 | 42% |
| 91601 | South San Fernando Valley (100% of its land in the city) | 6 | fewer than 5 | $9,003 | 15 | 0.07% | 1979 | 51% |
| 90732 | Harbor (98% of its land in the city) | 5 | fewer than 5 | $1,745 | 23 | 0.24% | 1971 | 69% |
| 90032 | Boyle Heights and Northeast LA (100% of its land in the city) | 5 | fewer than 5 | $4,140 | 11 | 0.08% | 1950 | 80% |
| 90015 | Downtown, Koreatown, Westlake and Pico-Union (100% of its land in the city) | 5 | 5 | $34,384 | 21 | 0.14% | 2004 | 30% |
| 90003 | South LA (100% of its land in the city) | 5 | fewer than 5 | $947 | fewer than 5 | Not shown | 1956 | 72% |
| 91306 | South San Fernando Valley (100% of its land in the city) | fewer than 5 | fewer than 5 | Not shown | 12 | 0.08% | 1965 | 76% |
| 90010 | Downtown, Koreatown, Westlake and Pico-Union (100% of its land in the city) | fewer than 5 | fewer than 5 | Not shown | fewer than 5 | Not shown | 2003 | 37% |
| 91331 | North San Fernando Valley and the foothills (100% of its land in the city) | fewer than 5 | fewer than 5 | Not shown | 6 | 0.02% | 1959 | 76% |
| 91411 | South San Fernando Valley (100% of its land in the city) | fewer than 5 | fewer than 5 | Not shown | 10 | 0.10% | 1969 | 67% |
| 91303 | South San Fernando Valley (100% of its land in the city) | fewer than 5 | fewer than 5 | Not shown | fewer than 5 | Not shown | 1983 | 45% |
| 90744 | Harbor (100% of its land in the city) | fewer than 5 | fewer than 5 | Not shown | 5 | 0.03% | 1960 | 71% |
| 90710 | Harbor (75% of its land in the city) | fewer than 5 | fewer than 5 | Not shown | 7 | 0.07% | 1975 | 62% |
| 90038 | Hollywood, Silver Lake, Echo Park and Mid-City (99% of its land in the city) | fewer than 5 | fewer than 5 | Not shown | 7 | 0.05% | 1965 | 68% |
| 90033 | Boyle Heights and Northeast LA (100% of its land in the city) | fewer than 5 | fewer than 5 | Not shown | fewer than 5 | Not shown | 1952 | 74% |
| 90031 | Boyle Heights and Northeast LA (100% of its land in the city) | fewer than 5 | fewer than 5 | Not shown | 25 | 0.19% | 1948 | 78% |
| 90007 | South LA (100% of its land in the city) | fewer than 5 | fewer than 5 | Not shown | 25 | 0.17% | 1961 | 70% |
| 90006 | Downtown, Koreatown, Westlake and Pico-Union (100% of its land in the city) | fewer than 5 | fewer than 5 | Not shown | 17 | 0.08% | 1955 | 73% |
| 91606 | South San Fernando Valley (100% of its land in the city) | fewer than 5 | fewer than 5 | Not shown | fewer than 5 | Not shown | 1962 | 76% |
| 91345 | North San Fernando Valley and the foothills (100% of its land in the city) | fewer than 5 | fewer than 5 | Not shown | fewer than 5 | Not shown | 1959 | 79% |
| 90071 | Downtown, Koreatown, Westlake and Pico-Union (100% of its land in the city) | fewer than 5 | fewer than 5 | Not shown | fewer than 5 | Not shown | No estimate | No estimate |
| 90062 | South LA (100% of its land in the city) | fewer than 5 | fewer than 5 | Not shown | fewer than 5 | Not shown | 1938 | 88% |
| 90013 | Downtown, Koreatown, Westlake and Pico-Union (100% of its land in the city) | fewer than 5 | fewer than 5 | Not shown | fewer than 5 | Not shown | 1944 | 64% |
| 90094 | Westside and the coast (100% of its land in the city) | fewer than 5 | fewer than 5 | Not shown | 12 | 0.17% | 2008 | 3% |
| 90079 | Downtown, Koreatown, Westlake and Pico-Union (100% of its land in the city) | fewer than 5 | fewer than 5 | Not shown | fewer than 5 | Not shown | No estimate | No estimate |
| 90057 | Downtown, Koreatown, Westlake and Pico-Union (100% of its land in the city) | fewer than 5 | fewer than 5 | Not shown | fewer than 5 | Not shown | 1965 | 68% |
| 90037 | South LA (100% of its land in the city) | fewer than 5 | fewer than 5 | Not shown | fewer than 5 | Not shown | 1949 | 72% |
| 90023 | Boyle Heights and Northeast LA (62% of its land in the city) | fewer than 5 | fewer than 5 | Not shown | fewer than 5 | Not shown | 1946 | 82% |
| 90021 | Downtown, Koreatown, Westlake and Pico-Union (100% of its land in the city) | fewer than 5 | fewer than 5 | Not shown | fewer than 5 | Not shown | 1938 | 82% |
| 90012 | Downtown, Koreatown, Westlake and Pico-Union (100% of its land in the city) | fewer than 5 | fewer than 5 | Not shown | 5 | 0.03% | 1988 | 33% |
| 90011 | South LA (100% of its land in the city) | fewer than 5 | fewer than 5 | Not shown | 7 | 0.03% | 1955 | 72% |
| 90002 | South LA (68% of its land in the city) | fewer than 5 | fewer than 5 | Not shown | fewer than 5 | Not shown | 1954 | 75% |
Years with the most claims
- 1998717 claims, $4,411,347 paid
- 1980693 claims, $2,667,062 paid
- 1983379 claims, $1,578,758 paid
- 1995222 claims, $630,653 paid
- 1978212 claims, $687,973 paid
Year is FEMA's year of loss. The storms behind the big years are on the Los Angeles flood history page: 1980, 1983 and 1998 were all wet winters with federal disaster declarations.
Source: FEMA OpenFEMA NFIP Redacted Claims v3, calculated by Los Angeles Water Damage & Mold on November 14, 2026. Total paid adds building and contents payments. Home age: U.S. Census Bureau ACS 5-year 2020-2024, tables B25034 and B25035. See sources and methods. This product uses the Federal Emergency Management Agency's OpenFEMA API, but is not endorsed by FEMA. The Federal Government or FEMA cannot vouch for the data or analyses derived from these data after the data have been retrieved from the Agency's website(s).
Look up one address's flood zone
- Open the city's NavigateLA map and search for the address.
- In the report window, choose the Parcel DFIRM Flood Zone Report.
- If that report isn't offered for the parcel, the Bureau of Engineering says the property may not be in a flood zone.
Source: LA Bureau of Engineering Permit Manual: Flood clearance (NavigateLA flood zone report). FEMA's Flood Map Service Center shows the same federal maps.
Water that comes in from outside falls under flood insurance, not a homeowners policy; the storm and flood water cleanup page and the Los Angeles water damage insurance guide. For leaks that start inside the house, the slab leak water damage page covers who owns which pipe.
Cite this page: “Los Angeles Flood Map: Flood Claims and Home Age by ZIP.” Los Angeles Water Damage & Mold, https://losangeleswaterdamageandmold.com/los-angeles-flood-map/. Updated November 14, 2026.